This is a project I worked on for Santa Barbara City College. The goal of this project was to create a new website for the college that would be more user-friendly and easier to navigate. I worked on this project as a UX Designer and Web Developer.
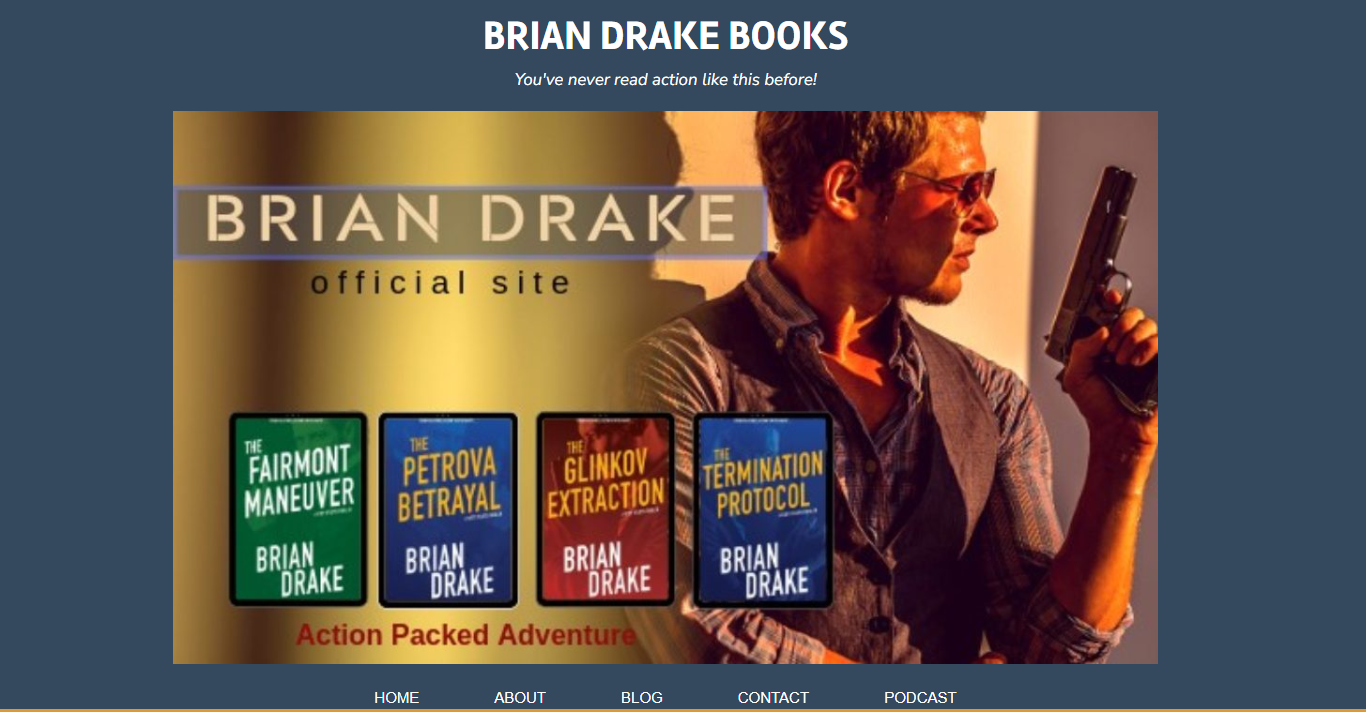
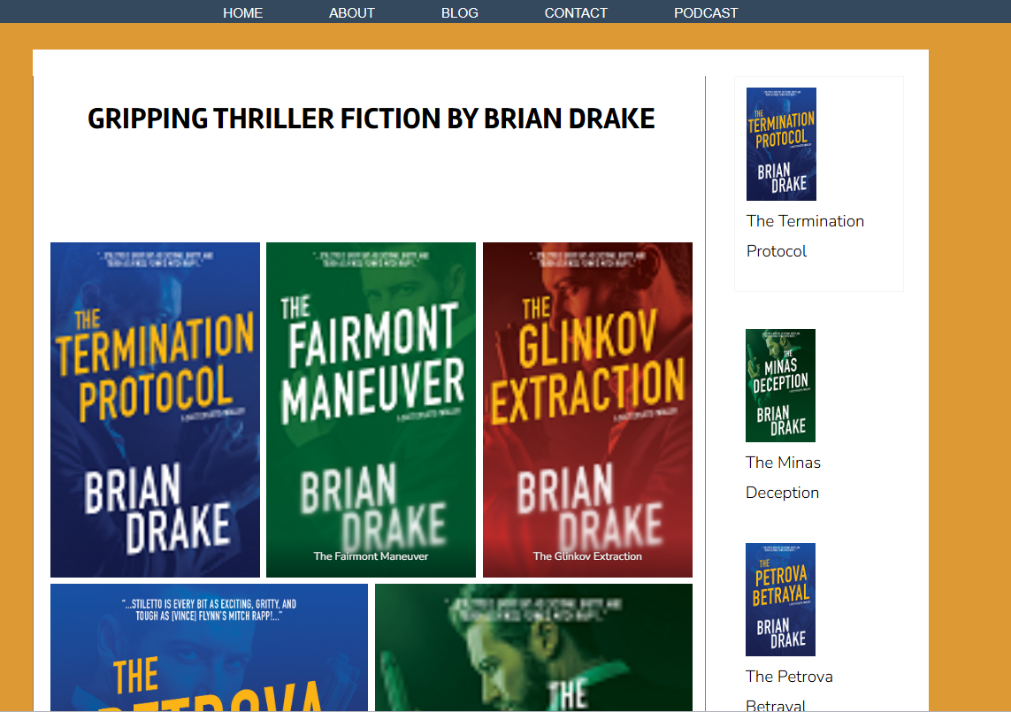
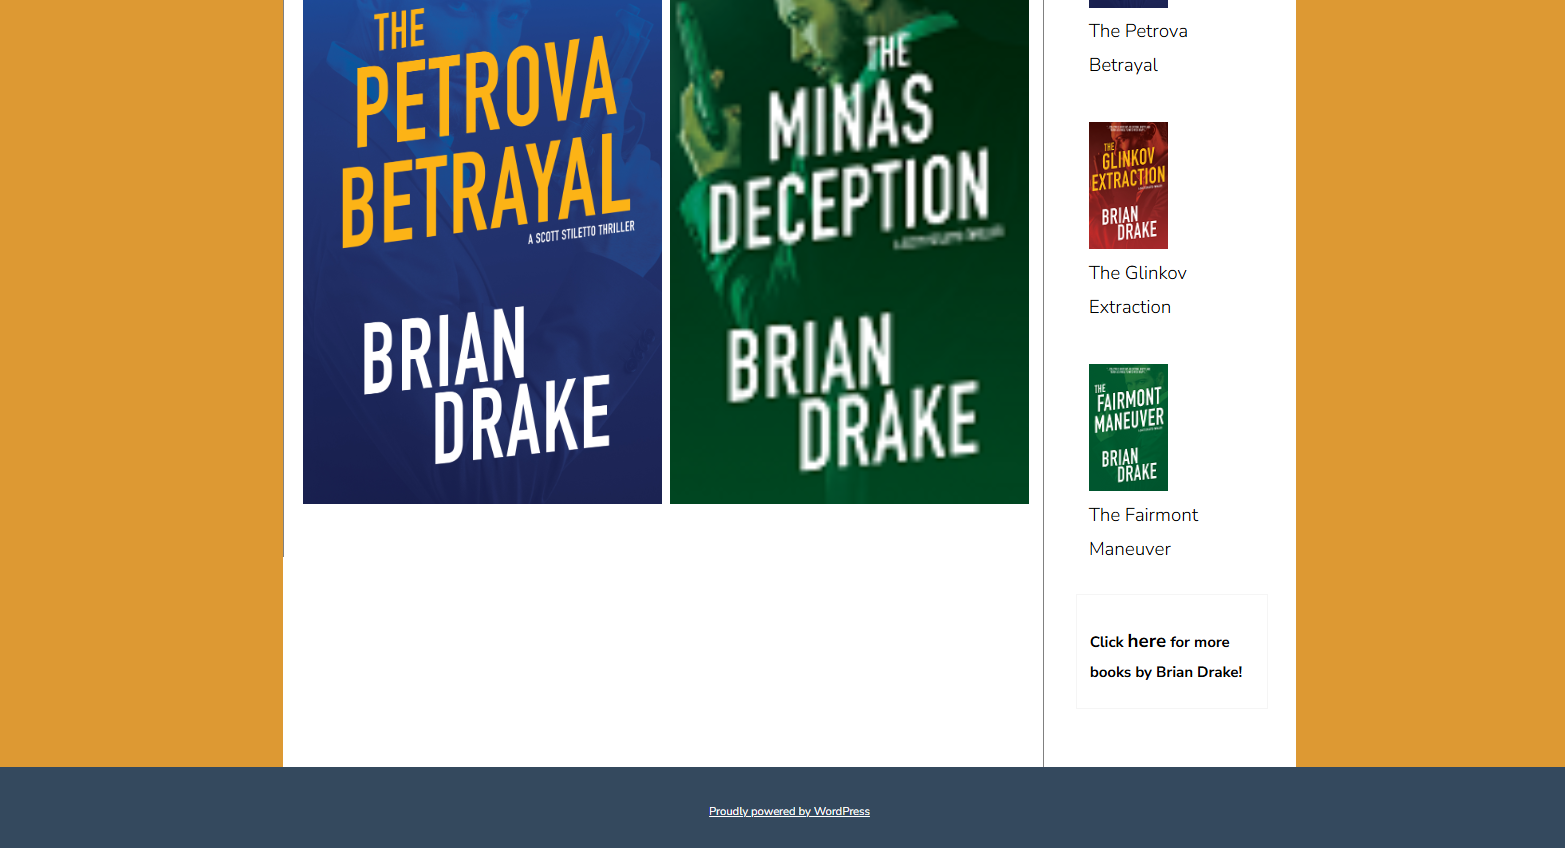
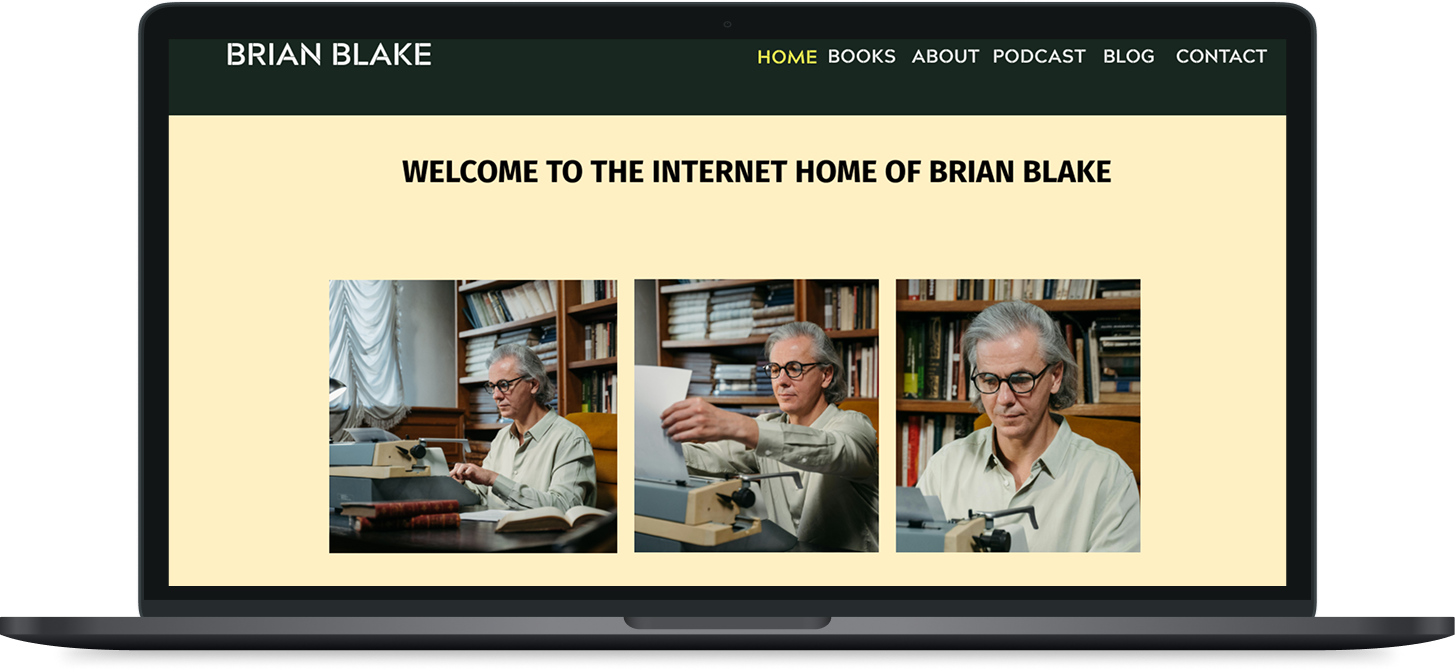
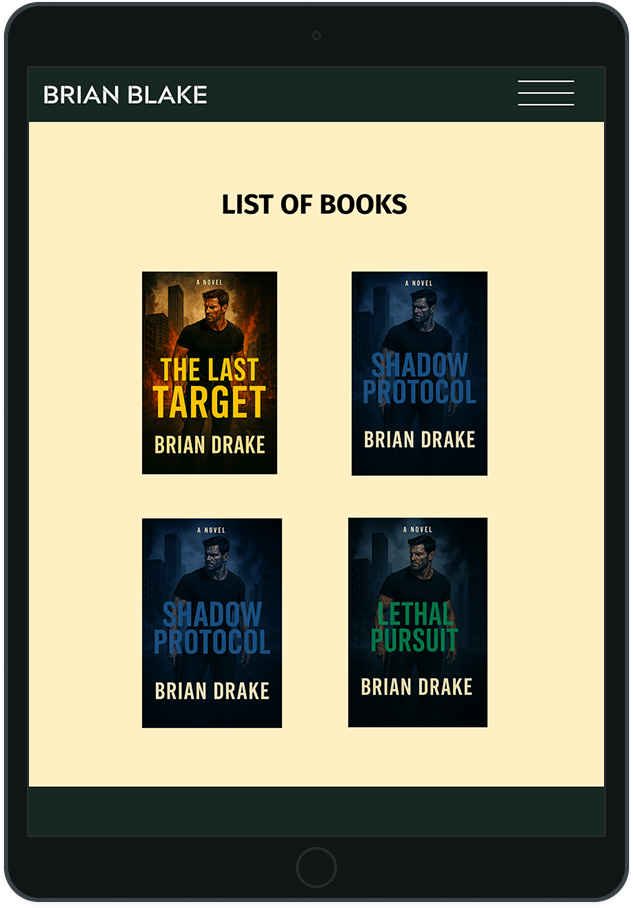
The purpose of this project was to redesign the author Brian Drake's website. Brian had a website that wasn't attracting visitors or generating leads for book sales. It was discovered during UX research that the previous website was hard to navigate due to an outdated design and difficulty finding things such as his books. After surveying the target market, the website was designed to look more professional and help readers find information more quickly and easily.
I was responsible for the entire redesign of the website. I conducted user research, created wireframes and prototypes, and designed the final website. I also implemented the website using HTML, CSS, JavaScript and Bootstrap.
After the website was created, the client was actively blogging, but stepped away to host a podcast. Recently, he signed with a new publisher and realized that he isn't attracting readers to his website. He realized he needed a new design not only for aesthetics but to help his readers find the information easily, most importantly, where they can purchase his books.
| Before Launch (4/6/25 - 4/6/26) | After Launch (4/6/26) |
|---|---|
| Total Clicks - 55 | Total Clicks - 19 |
| Total Impressions - 948 | Total Impressions - 375 |
| Average CTR – 5.8%/td> | Average CTR - 5.10% |
| Average Position – 17.7 | Average Position - 11 |
Following the redesign and improvements, it didn't take long for the client's online presence to start off. So far, the site has gotten 19 clicks, 375 impressions, an average CTR of 5.1% , and an average position of 11. A 61% increase from last year.
| Before Launch (4/6/25 - 4/6/26) | After Launch (4/6/26) |
|---|---|
| Engagement Rate – 12.2% | Engagement Rate - 100% |
| Average Engagement Time - 4sec | Average Engagement Time – 19 sec |
| Pages Per Session (Views Per User) – 12.2 | Pages Per Session (Views Per User) - 2 |
| Returning Users - 19 | Returning Users - 1 |
Since the redesign of the website, visitors are spending more time as there was a 21% increase in time spent on the website.