Southern Belle Cleaning Co. Website Design
Overview
Southern Belle Cleaning Co is a residential cleaning business that relied primarily on word-of-mouth referrals for new customers. While the company had built a loyal customer base over three years, the owner wanted to increase revenue and attract more clients online. The challenge was that potential customers often struggled to contact the business quickly because the owner was actively cleaning homes during business hours and could not always answer incoming calls immediately. Without a professional website or online booking option, the business was missing opportunities to convert interested prospects into paying customers.
My Role
Led the end-to-end UX/UI design process, including user research, wireframing, prototyping in Figma, and WordPress development to create a conversion-focused website that increased client leads and revenue.
PROBLEM
Southern Belle Cleaning Co relied solely on word-of-mouth referrals and had no website, making it difficult for potential customers to discover the business online. Because the owner was often busy cleaning homes, phone calls frequently went unanswered, resulting in missed leads. The business needed a professional website that would increase online visibility, build credibility, clearly communicate its services, and provide an easy way for customers to request a quote or book a cleaning appointment.
ACTION
Research & Discovery
To better understand user expectations, I conducted UX research focused on the home cleaning industry.
Research Methods
- Surveys
- Interviews
- Observational Studies
Key Findings
Research showed that potential customers primarily wanted:
- Fast and easy communication
- The ability to call or request appointments online
- Observational Studies
UX/UI Design Process
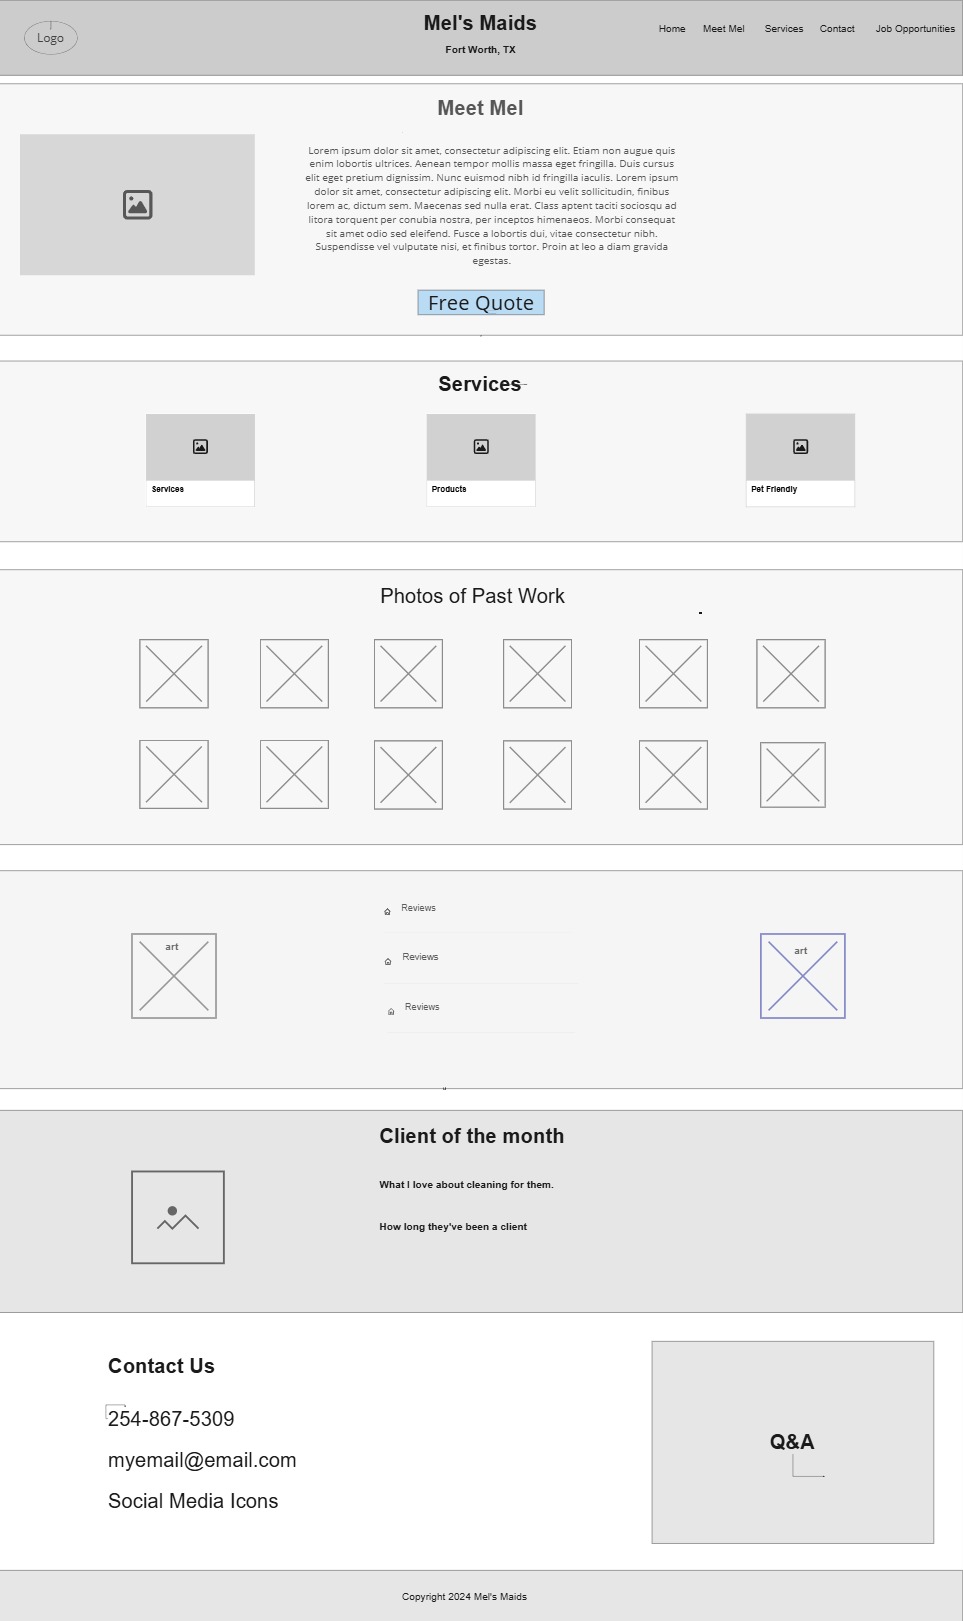
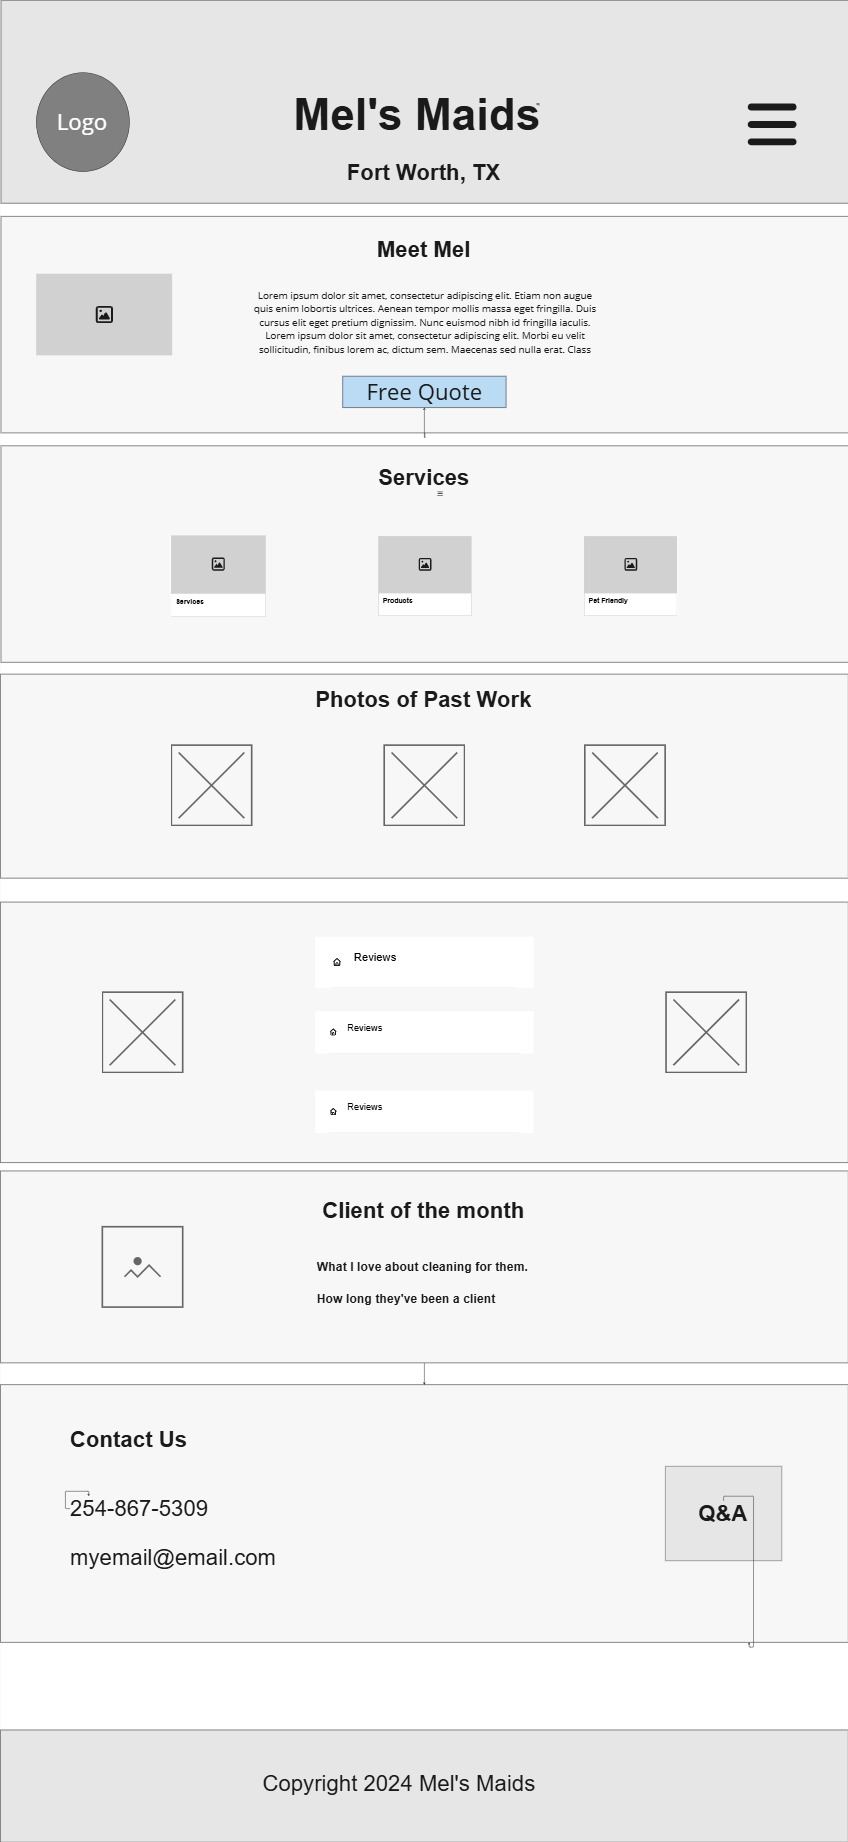
Wireframing
I created low-fidelity wireframes focused on:
- Simplifying navigation
- Making contact options immediately visible
- Highlighting services and trust signals
- Reducing friction in the booking process
The client approved the wireframes after two rounds of revisions.
UI Design & Prototyping
Using Figma, I designed a modern, user-friendly interface tailored to the client’s audience.
Design Priorities
- Mobile-friendly experience
- Clear call-to-action buttons
- Simple service breakdowns/li>
- Warm, trustworthy branding/li>
- Easy appointment request flow
The interactive prototype went through two rounds of revisions before final approval.
Development
The final website was developed in WordPress to give the client an easy-to-manage platform for future updates.
Feature Implemented
- Responsive mobile design
- Contact form
- SEO-friendly structure
- Service pages
- Clear CTA placement
- Fast-loading layout optimized for conversions
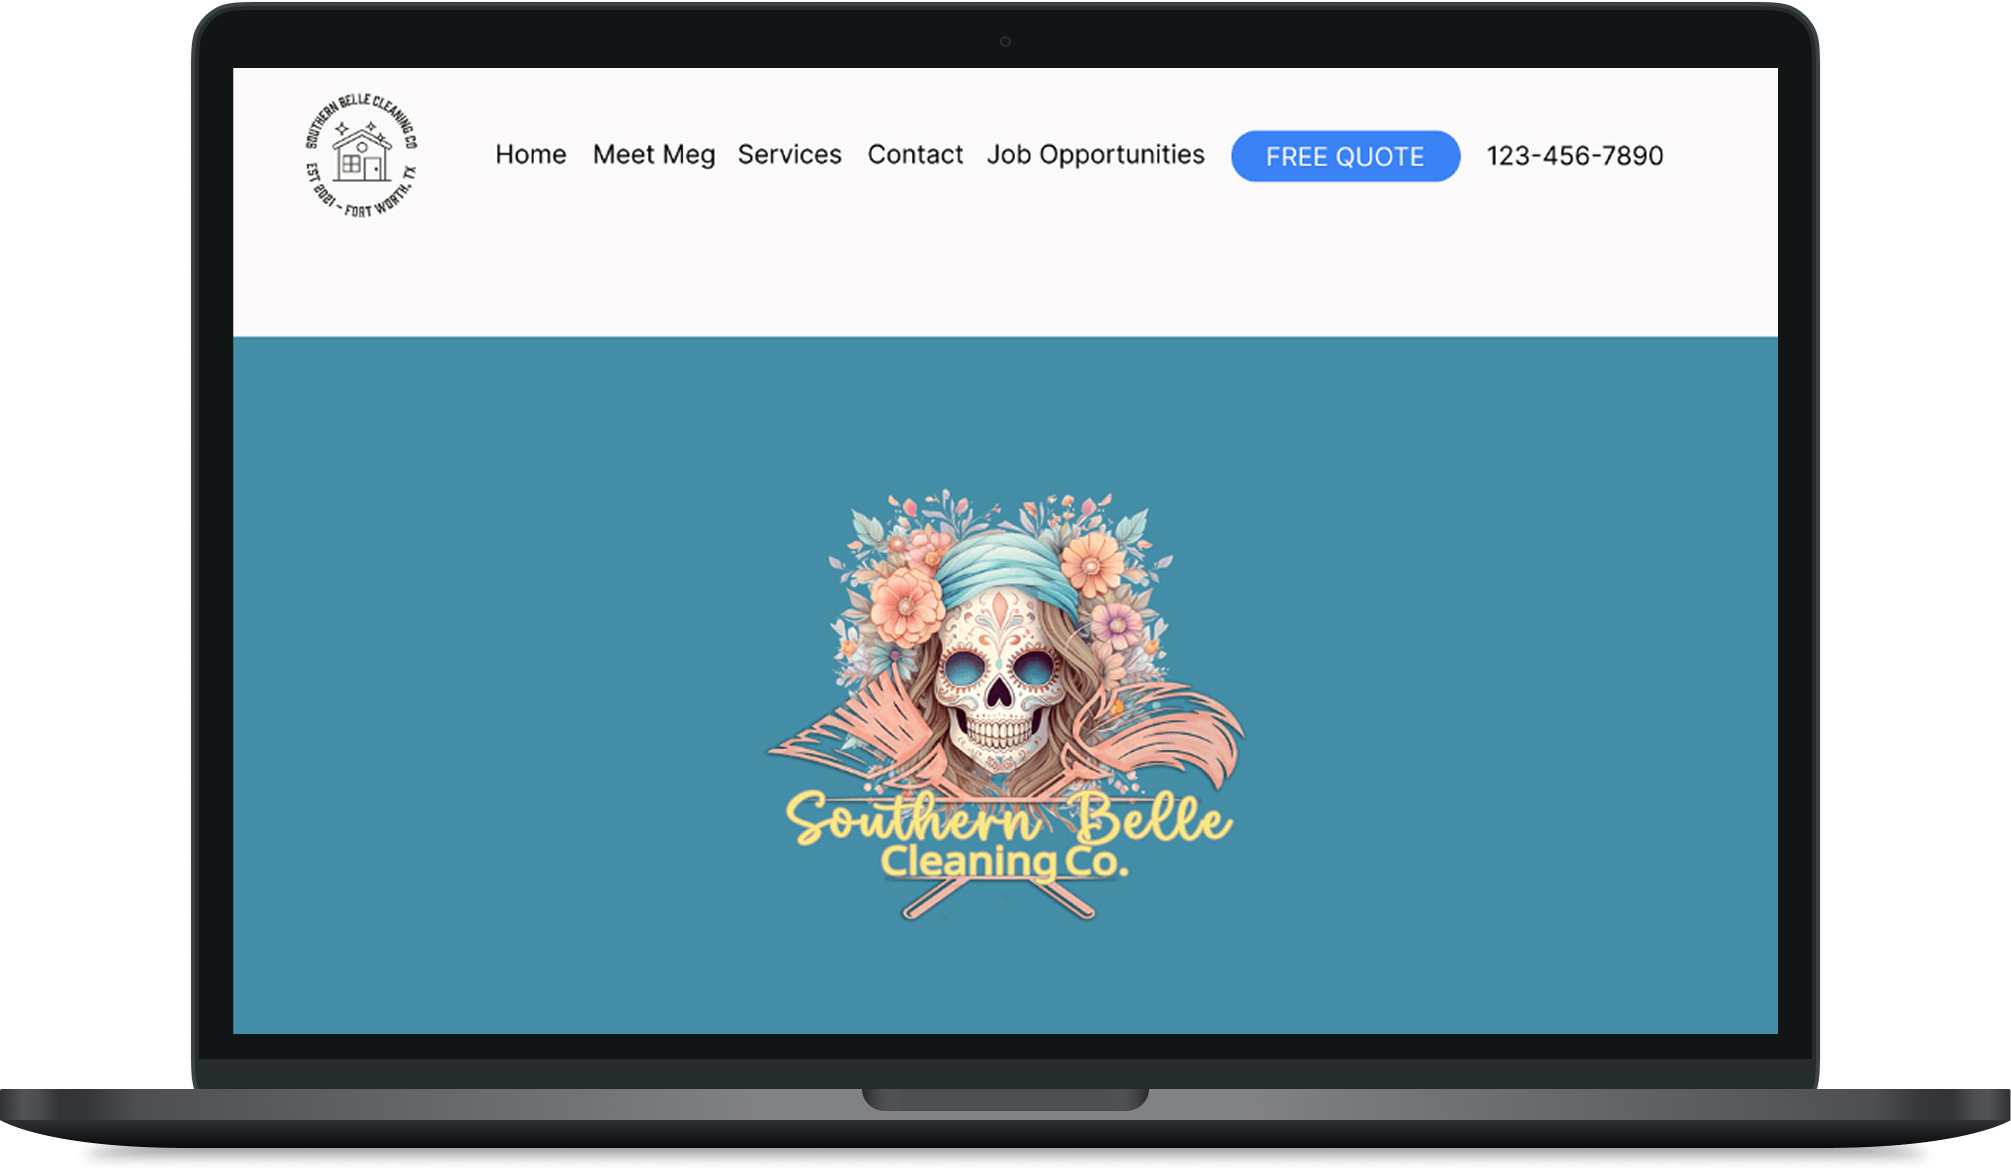
Desktop
Mobile
RESULT
Establishing an Online Presence
| First Year (March 10, 2025 - March 10, 2026) | Second Year (March 10, 2026 - July 10, 2026) |
|---|---|
| Total Clicks - 7 | Total Clicks - 6 |
| Total Impressions - 328 | Total Impressions - 289 |
| Average CTR – 2.1% | Average CTR - 2.1% |
| Average Position – 13 | Average Position - 7.7 |
Since launching the website, search performance has continued to improve. Although the second reporting period covers only four months, the site generated nearly as many impressions (289 vs. 328) and clicks (6 vs. 7) as it did during the entire previous year. The average search position improved significantly from 13 to 7.7, moving the website onto the first page of Google for more searches. While the click-through rate remained steady at 2.1%, the improved rankings indicate stronger visibility and increased opportunities for attracting qualified local traffic.
Connecting with Customers
| First Year (March 10, 2025 - March 10, 2026) | Second Year (March 10, 2026 - July 10, 2026) |
|---|---|
| Engagement Rate – 32.1% | Engagement Rate - 24.5% |
| Average Engagement Time - 32 sec | Average Engagement Time – 17 sec |
| Pages Per Session (Views Per User) – 1.3 | Pages Per Session (Views Per User) - 1.2 |
| Returning Users - 11 | Returning Users - 1 |
Google Analytics showed that visitors continued engaging with the website after launch. During the first year, users had a 32.1% engagement rate, spent an average of 32 seconds on the site, and viewed 1.3 pages per session. In the second reporting period (four months), the engagement rate was 24.5%, with an average engagement time of 17 seconds and 1.2 pages per session. While engagement metrics declined slightly, they remained relatively consistent. Because the second period covers only four months, it also recorded fewer returning users. Combined with the improved Google Search rankings, these results indicate the website continued attracting visitors and generating opportunities for new customer inquiries.
Since launching the website:
- The website established a professional online presence, making it easier for prospective customers to discover and contact the business.
- Google Search rankings improved significantly, with the average search position increasing from 13 to 7.7, placing the site on the first page of Google for more searches.
- Search visibility remained strong, generating nearly the same number of impressions and clicks in four months as it had during the previous twelve-month period.
- Visitors consistently engaged with the website, helping strengthen the company's credibility and supporting continued customer growth.
Following the successful launch, I continued providing digital marketing and SEO services for one year to improve search visibility, monitor website performance, and support the client's long-term growth.